Understanding the differences between the types of dashboards is a must if you’re designing visualizations or looking into getting dashboards built. Once you understand the main principles, you can ensure the dashboards will better serve the users they’re being built for, resulting in enhanced decision-making and being sure your analytics investment is realized.
Strategic Dashboards:
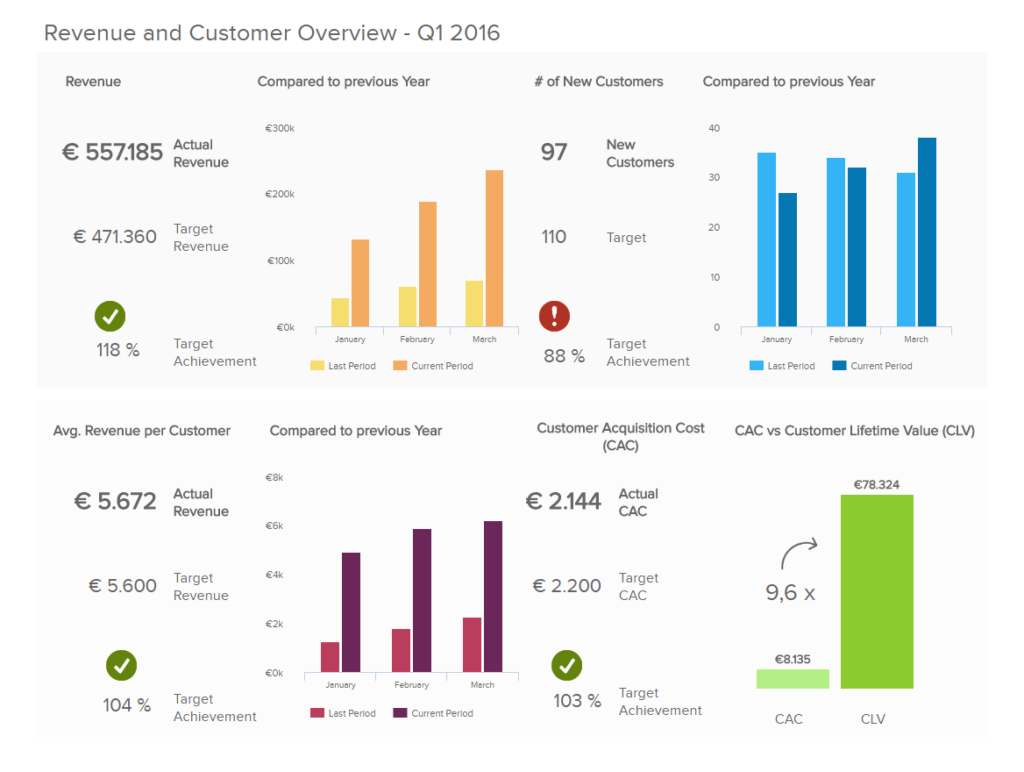
Strategic dashboards provide a view into the business’s overall health at the enterprise and department/division levels. The focus is typically to track key performance indicators (KPI) against a target value or range to determine performance metrics. This allows for executives and line of business leaders to quickly follow the performance of sales, products, customers, financials, outcomes, etc against business objectives.
The executive can then identify areas of the business where action needs to be taken or further analysis is needed; often then assigned to an analyst leveraging an analytical dashboard. These dashboards may also include forecasting and other tools to support long-term strategy development.
Below is an example of a Strategic dashboard:
Operational Dashboards:
Operational dashboards are typically used by line of business managers and knowledge workers to execute daily business functions. Data tends to have shorter time frames and tracks operational processes.
Some examples of operational dashboards would be the count of customers currently in the queue to reach a call center agent with hold times, current outstanding orders to be fulfilled/processed by inventory warehouse location, and current team members working a shift or about to start a shift vs real-time customer traffic. The list is endless. These dashboards provide the right people with the right information at the right time which is crucial to success.
Check out our case study on Atmos energy to take a look at real-world examples of operational dashboards:
Analytical Dashboards:
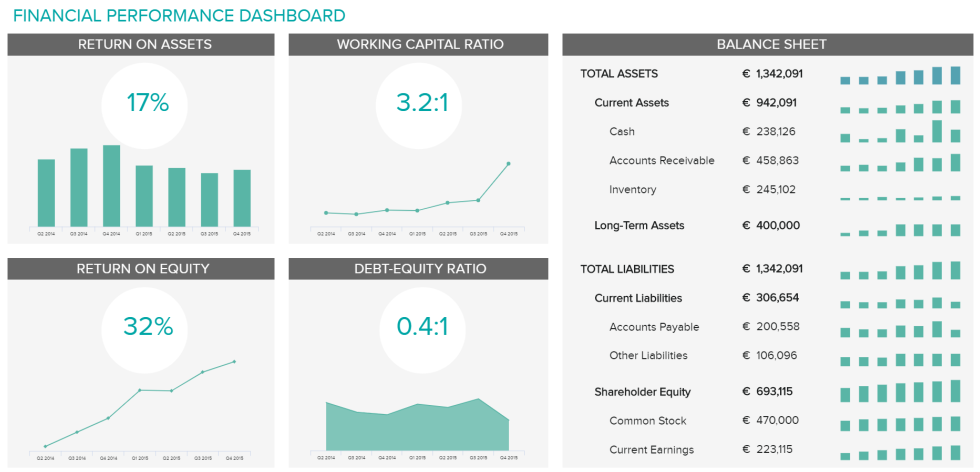
An analytical dashboard is typically used for data discovery, to develop or prove a business hypothesis, to provide evidence for fact-based decision making, or to identify new insights. These dashboards typically contain vast amounts of data and are designed to allow an analyst to more easily find insights that are difficult or impossible to identify with aggregated data. Analysts can identify trends and outliers, drill into and across the data to identify areas for action, and provide insights to management. Analytical dashboards may also provide the user interface to predictive models, machine learning, and AI result sets.
Below is an example of an analytical dashboard:
Interested in learning more?
Check out our FREE Tableau style guide! it’s full of vital information for building effective and visually appealing dashboards! Or have a look at our Case Studies, full of real-world examples of these dashboards in action.