Suez is one of the world’s leading environmental companies, providing clean drinking water to 92 million people across 70 countries and 5 continents.
Business Need
Suez needed a way to provide automated customer-facing reports to its numerous customers to show how chemical treatments impacted water quality and equipment performance. The previous reporting was often difficult and limited due to the large, very granular data sources.
The Solution
DataBrains created enhanced reporting and KPI analytics for Suez, providing insight on the overall health of equipment, plants, and systems. DataBrains achieved four main results of the project:
Increasing data transparency:
DataBrains worked closely with Suez IT to create curated data sources using up-to-the-minute data with IoT devices in the field. This approach allows engineers to walk through a customer’s data and show customers how equipment is performing when treatments should be conducted, and when equipment will likely need to be replaced.
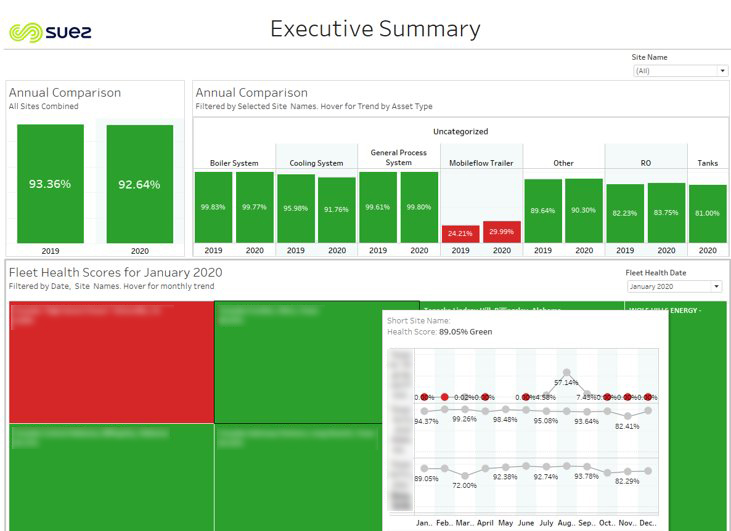
Commercial Fleet Reporting:
DataBrains developed dashboards to view Suez’s data across an entire network of plants. These dashboards allowed for engineers to drill down into specific equipment at customer sites to determine where problems were occurring and speed up the cycle of correcting any fouling or contamination of equipment. The health of the plant was denoted by color, making it easy to identify plants in need of corrective measures.
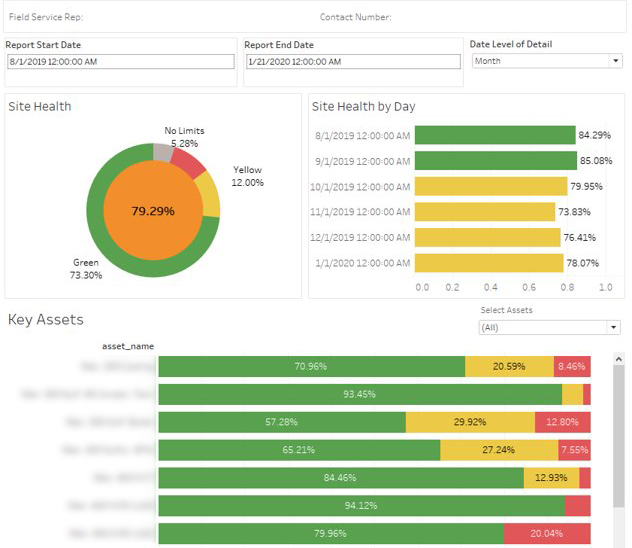
Plant Health Reporting:
DataBrains developed dashboards to view Suez’s data at a single customer plant. The dashboard displays the plant’s overall health across a user-selected period, as well as the health of all systems at that plant.The dashboard also gives you the ability to drill from one asset to the next and view all of the metrics that determine the health of the asset, serving as an early warning system to determine if an asset is likely to fail.
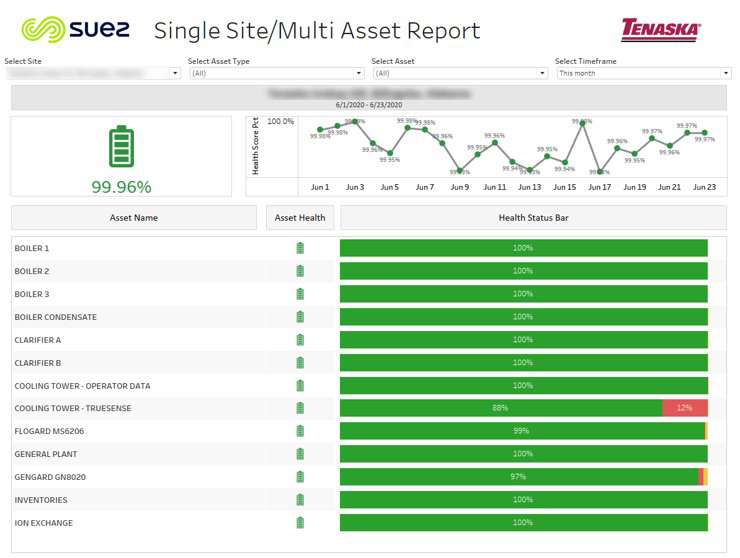
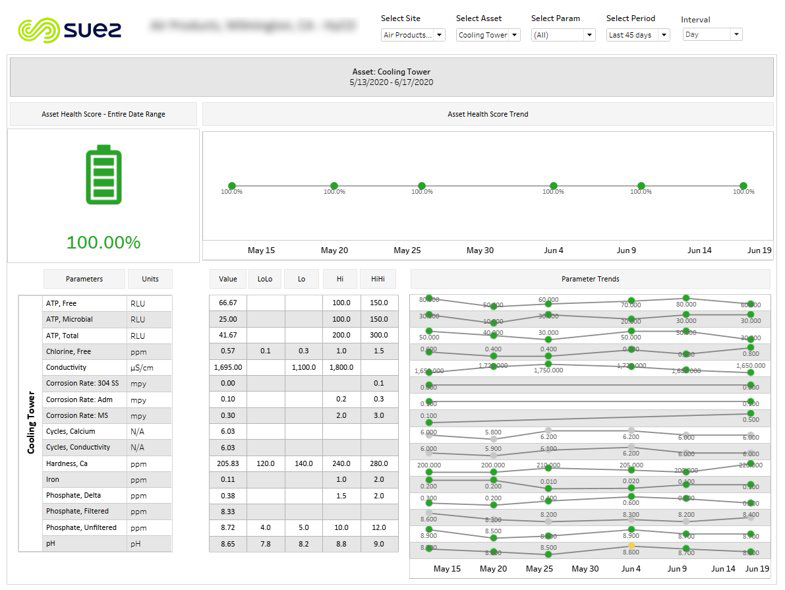
Equipment Based Metrics:
DataBrains created dashboards to dig into how individual systems were performing at a granular level. Engineers and customers can view a system in many ways to ensure that costs are not ballooning due to faulty equipment. The report card was built to generalize across numerous types of water equipment such as cooling towers and boilers. This cut down on the need to make custom dashboards for different equipment and locales while not losing any ability to explain what is happening on the ground.
We use cookies to ensure that we give you the best experience on our website. If you continue to use this site we will assume that you are happy with it.Ok