Background
Atmos Energy Corporation is one of the United States’ largest natural-gas-only distributors, serving about three million natural gas distribution customers in over 1,400 communities in nine states.
Business Need
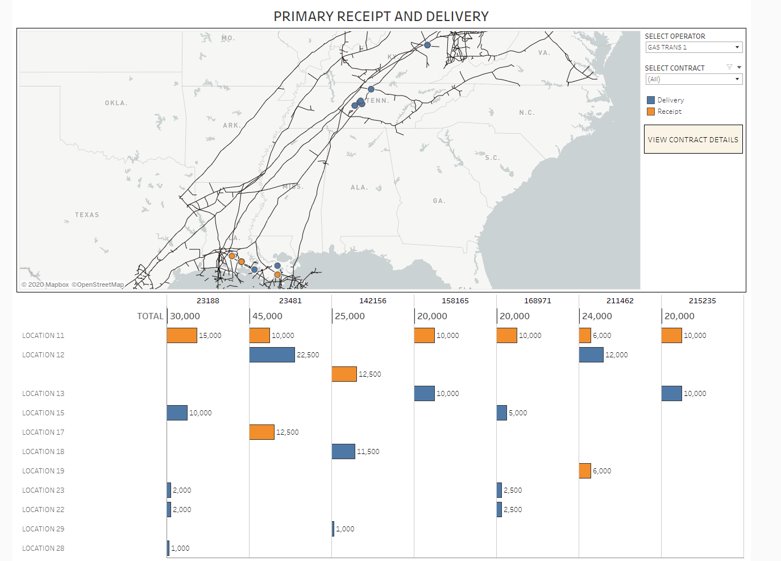
Atmos needed to see the amount of gas transferred between locations – how much was delivered vs how much was received at different points along the pipeline. The users needed to have the ability to select a specific operator and contract and view all stops along the Atmos Energy pipeline.
The Solution
DataBrains migrated reporting from Necto Panorama to Tableau. Necto was a cube-based platform that reported on hundreds of metrics across finance, operations, and marketing. DataBrains replicated the functionality in Tableau and produced 40 dashboards to be used by the operations team.
To accommodate their need for dynamic hierarchies, DBI used parameters. The end-user can choose which hierarchy they are interested in drilling down into. The Hierarchies always started with Region > Branch, but levels 3-5 are different based on the hierarchy that was chosen.
Separate case statements for each level identifying which field should be shown for each corresponding hierarchy. For example, If the company hierarchy was chosen, the dashboard should show route. If Payment Method was chosen, level 3 would show Payment Me
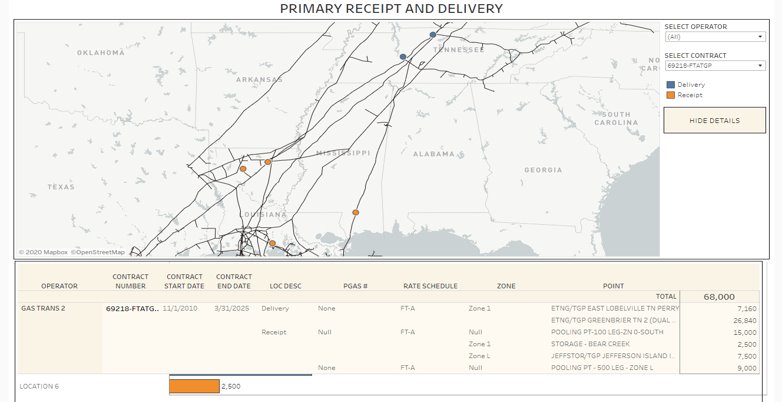
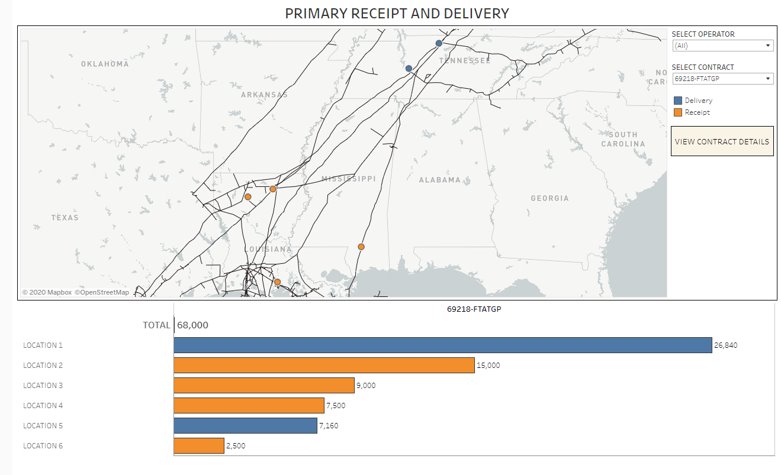
We provided dashboards that leveraged EIA data to draw the pipelines that focused on Texas Eastern Transmission Company, Columbia Gulf Transmission, and East Tennessee Natural Gas Pipeline. The source data provided had Receipt (where Atmos brought gas onto the system) and Delivery points (where Atmos took gas into Atmos distribution system to disperse to their customers).
Our dashboards allowed full graphical representation of the pipelines, all the receipt points as one color, the ability to hover over a point on the map and see the meter or point details that are specific to a transaction/record. All the deliveries points were displayed as a separate color, with the ability to hover over the point on the map and see the meter or point details that are specific to a transaction/record. We also provided the ability to toggle between contracts (contact number) and see their respective receipt and delivery points on the map, as well as the ability to highlight the section of pipe between receipt and delivery points for any given contract.