Optimizing Data Management and Reporting For Higher Education
Lynn University is an American private university in Boca Raton, FL founded in 1962. The university is accredited by the Commission on Colleges of the Southern Association of Colleges and Schools to award associate’s, baccalaureate, master’s, and doctoral degrees.
Organizational Challenges:
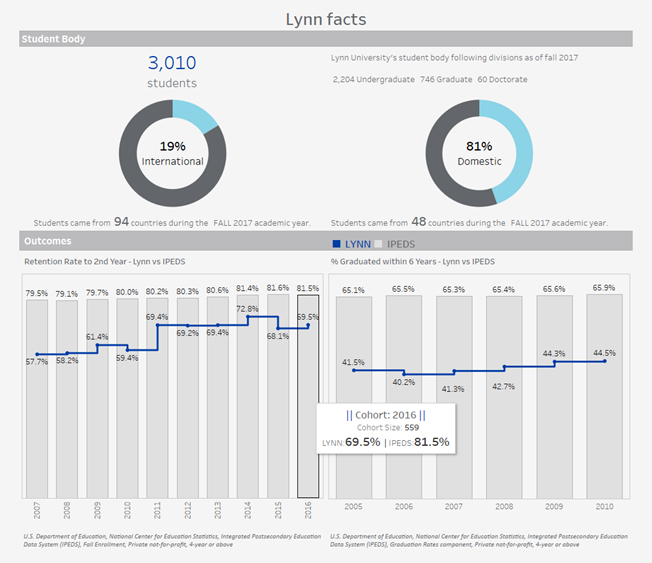
The Office of Institutional Research, Planning, and Assessment publishes an annual Fact Book every year showing year to year comparative data regarding Admissions, Enrollment, Retention, and Graduation.
The Lynn University Institutional Research (IR) team wanted to convert their tabular fact book into clear, insightful visual analytics, powered by Tableau.
The Challenge:
The current Fact Book combined SQL query results from Excel to a published PDF. Even with their extensive process to include the information that matters, they really needed to see the data across various subject areas.
As they ran the queries and export the results in Excel on an annual basis –essentially building the fact book from scratch, their hardcoded calculations for Class Type, New vs. Returning, and Cohort Type needed to be manually changed to refer to the correct year.
The Solution:
DataBrains’ certified Tableau consultants connected directly to Lynn University’s base table while also adding some new tables in Tableau to produce the necessary fields inclusive of all subject areas.
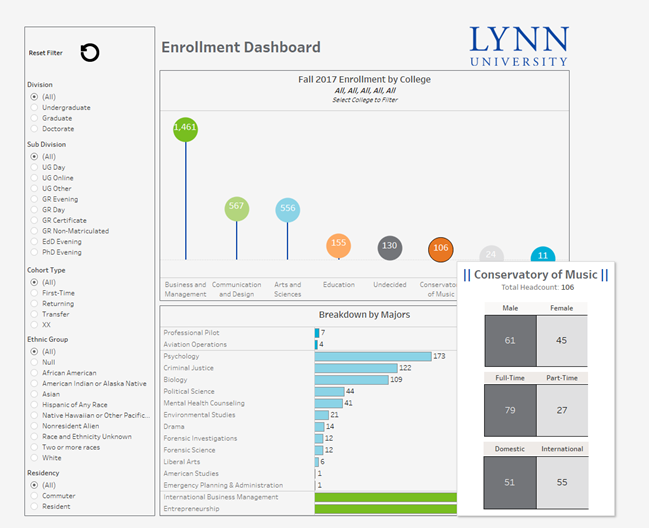
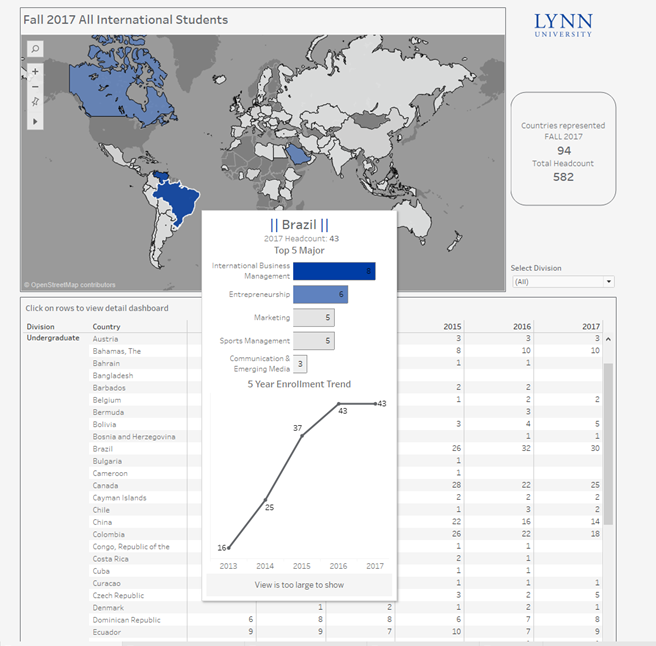
DataBrains combined both their Annual and Year-to-Year comparison into a single dashboard where the visualization presents the current year information while the viz in tooltip depicts the 5-year trend. DataBrains also built a sophisticated landing page to help end-users navigate from the landing page to the respective subject areas and easily find their way back to the home if needed.
Tableau offers dashboards that are dynamic in nature. With just a quick filter selection, the IR team could see data for the next or previous year. Furthermore, the calculations for Class Type, Cohort Type, and New vs. Returning was now dynamic.
DataBrains designed the user interface using Lynn University’s standard color scheme. The landing page in Tableau presented the information as it is seen on the Lynn University Facts web page.
With multiple filters initially showing on the landing page, we gave Lynn University the functionality to reset all the filters with a click of a button. All of these improvements delivered a tremendous amount of efficiency, saving the IR department weeks and weeks of development effort.